Economic and Investment Outlook for 2026

2026 Outlook Summary
- Economic Growth: AI and other productivity improvements suggest lower inflation and interest rates. Tariff impacts are still being passed through, but their inflation impact has been largely offset by productivity acceleration. CapEx spending by businesses and deregulation are expected to result in good overall growth. Employment remains a weak spot, but a large increase in unemployment is not expected.
- Growth outside the U.S.: Weak in Europe and Japan, but recovering. Better in China. Weak housing market in China is offset by still strong exports and competitive advantages. AI advances are also improving results, though future unemployment remains a challenge.
- U.S. Equities: The S&P 500 is still historically expensive, though earnings growth has largely supported stock price increases. Strong economic growth, lower expected interest rates, and productivity improvements boosting corporate earnings suggest that U.S. stocks can have another positive year.
- Foreign Markets: The >10% decline in the dollar in 2025 resulted in most foreign assets generating higher returns than their U.S. counterparts. The dollar may stabilize due to foreign investment inflows, but long-term, the dollar could be under pressure. Foreign stocks are still undervalued, so some outperformance could continue into 2026.
- Fixed Income: U.S. short-term interest rates are expected to decline further in 2026. A new Fed Chairman in May and lower-than-expected inflation could result in much lower interest rates by the end of the year. While this would be good in the short run, it may increase inflation in 2027, causing both long and short-term interest rates to rise. Long-term interest rates declined in 2025. Lower inflation outcomes in 2026 should reduce long-term interest rates, but increasing government deficits are a counteracting force.
- Alternative Investments: These still have a place in portfolios due to lower correlations when compared to stocks and bonds. Alternatives include commodities, real estate/REITs, and various hedged strategies (e.g. merger and convertible bond arbitrage) and private non-traded investments.
- Geopolitical Risks: Russia, China and US intervention and tariff risks continue to create global instability and are a drag on government finances and global growth. This should create enough asset price volatility for opportunistic investing.
Productivity Improvements key to Lower Inflation and Interest Rates
U.S. inflation trended down in the U.S in 2025, with the CPI showing a 12-month year-end reading of 2.7%. While tariffs may have boosted inflation by more than 0.5% in 2025, the 2025 reduction in inflation has more than offset tariff effects.
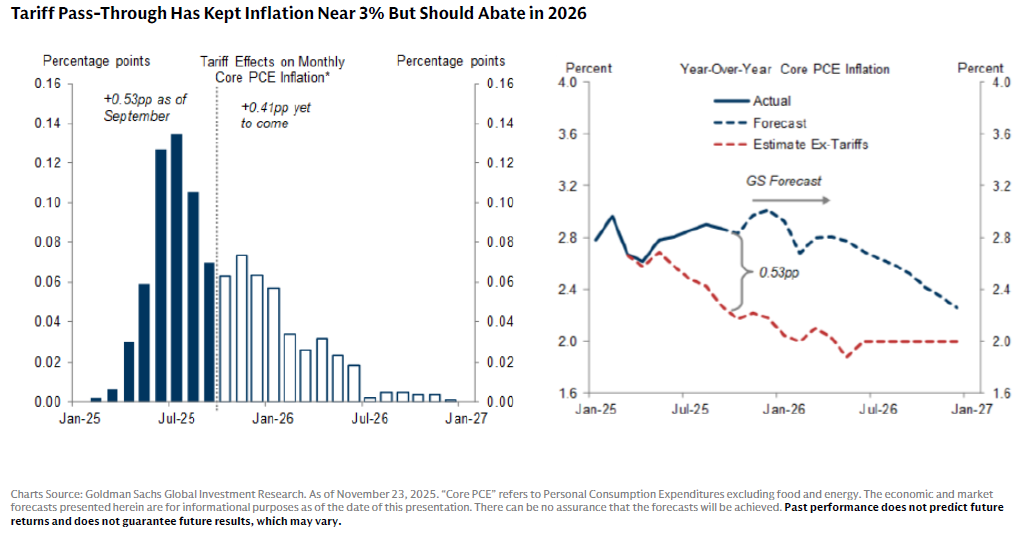
The chart on the upper left shows that most of the tariff impact occurred in 2025, with a diminishing impact expected in 2026. The chart on the upper right suggests that core inflation would have been closer to 2.3% if tariffs had been excluded, and that ex-tariff inflation is expected to decline to close to 2% by year-end 2026. Even including cumulative expected tariffs, overall inflation is expected to decline to about 2.3% by the end of 2026.
If the U.S. courts invalidate some of the “national security”-related tariffs, tariffs would be rolled back and 2026 inflation could be lower. However, this would also mean less revenue for the U.S. government, which would put upward pressure on budget deficits and long-term interest rates.
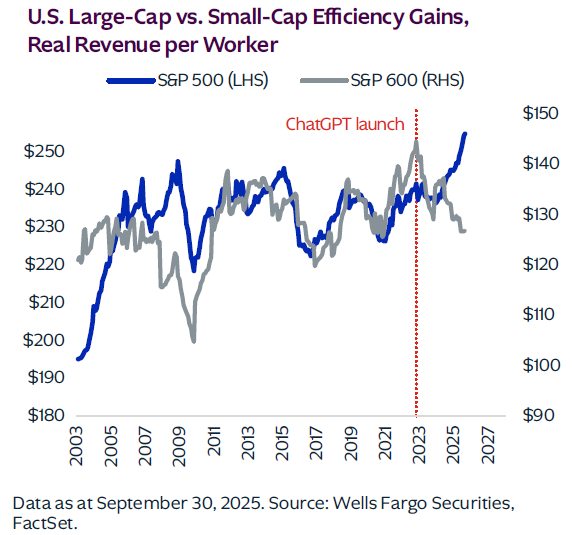
The chart to the left shows how revenue per worker has increased since the introduction of ChatGPT among larger firms (first adopters). This was not the sole reason for increased productivity. Supply chain improvements, increasing use of robotics and normal productivity improvements, including all forms of AI, have contributed to improved productivity.
Productivity gains appear to be accelerating as larger firms continue to use AI for additional uses and smaller businesses begin adopting AI for some tasks. The Bureau of Labor Statistics (BLS) just announced that third-quarter 2025 productivity increased at an annualized rate of 4.9%. As hourly compensation only increased 2.9%, this means that unit labor costs decreased by 1.9% which is deflationary, not inflationary. Over the prior 12 months, unit labor costs only increased by 1.2%, which has been disinflationary.
The flip side of this is that fewer workers are needed to supply the same goods and services. The unemployment rate increased over 2025 to 4.7%–still low, but rising. Nevertheless, weekly new jobless claims have remained low all year. Most corporations are in a “don’t fire, don’t hire” mode. They are expanding their businesses and doing well so there is no need to fire, but higher productivity and uncertainty over tariff and other policies make them reluctant to hire.
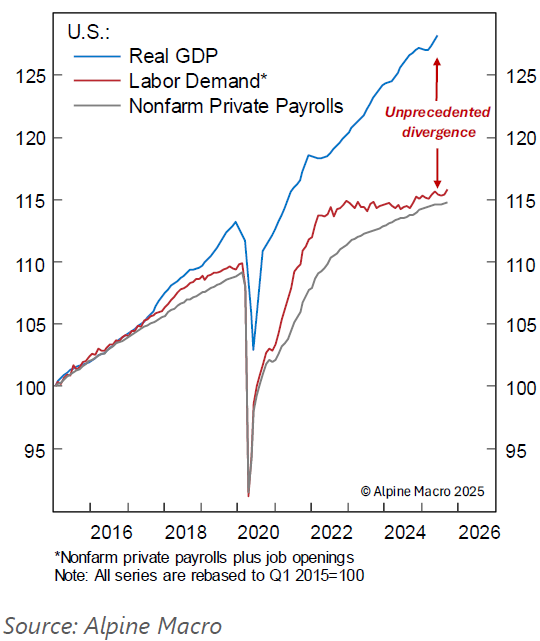
This is reflected in the chart to the left showing how inflation-adjusted GDP growth has been strong, but with muted labor demand over the last few years. High productivity should be good for both lower inflation and lower interest rates, but not as good for the labor force.
The recently-passed OBBBA tax law is expected to boost GDP by close to 0.5% this year and bit less thereafter. Data center and other infrastructure projects and foreign countries’ commitments to build factories and facilities in the U.S. are also good for growth and should support some job growth this year and perhaps the following year. Nevertheless, if AI is “too good” at replacing some functions and people, unemployment could accelerate further. This could pressure the Federal Reserve to cut interest rates faster than expected later this year or next year.
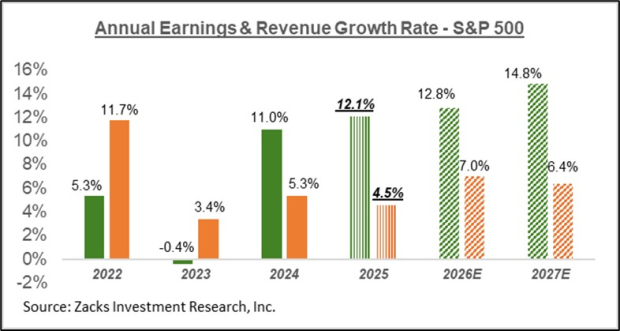
Corporate profits are the direct beneficiary of higher productivity. Lower interest rates would help businesses too. Even if US GDP only rises 2-3% in 2026, S&P 500 profits are expected to increase about 12.8%, continuing to accelerate over prior years (green bars below).
Risks to Improved Economic Outlook
Risks to lower inflation and interest rates include the possibility that productivity improvements will taper off. Tariff impact may exert a stronger-than-expected 2026 boost to inflation. A surge in infrastructure build-out could raise wages and labor demand, as construction and many services are labor-intensive, and AI does not provide much benefit. Nevertheless, current trends suggest a long multi-year runway for continued strong productivity and inflation improvements.
Lower income taxes due to 2025’s OBBBA are expected to increase the federal budget deficit noticeably over the next decade. More government interest expense will take up more of the government budget, reducing economic growth. Furthermore, increased debt issuance is likely to drive up interest rates, even if inflation is steady. Likely fiscal stimulus before midterm elections could add to this. Even though tariffs create inflation and business issues, should the Supreme Court roll them back, the budget deficit would worsen and long-term interest rates and mortgage costs could increase. The good news is that some of the negative effects would occur in future years, but bond market “vigilantes” could spike interest rates higher at any time.
Many non-U.S. economies are much weaker than that of the U.S. Germany is just coming out of a recession and French budget imbalances and higher financing costs are jeopardizing progress. Japan is still fragile, though some improvement in growth is occurring. China is dealing with a deflationary housing bubble implosion. Iran, Venezuela, Russia, and Ukraine troubles and U.S. intervention policies are just a few of the countries that could further negatively impact the rest of the world.
Nevertheless, there are positive factors at work for global economies. Inflation in most major economies appears to be waning, with low interest rates well-established, except in Japan. While economic growth is not expected to be as strong as in the U.S., it appears to be improving. Increased defense spending in Europe and Japan, improvements in energy supplies and cheaper currencies are providing a boost to economic growth. Despite poor residential markets in China, continued growth in exports, a cheaper currency, and its own rapidly growing AI/Tech sector suggest that GDP growth in China will continue to exceed that of the U.S. and other large developed economies.
Investment Implications for U.S. and non-U.S. Stocks in 2025
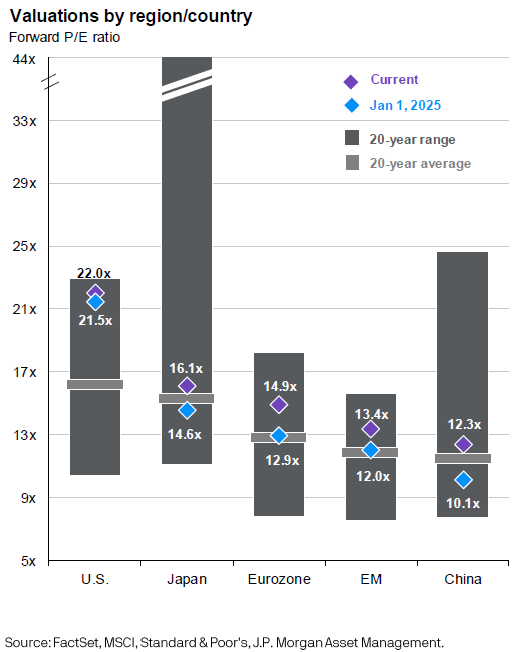
To the left are current valuations of some major global stock markets along with comparisons to a year ago and the 20-year average valuations. The subsequent chart shows the stock market returns for these markets and how much was due to currency effects, dividends, earnings growth and multiple expansion (increase in P/E ratios).
The S&P 500 is currently valued at a forward P/E ratio of 22 times earnings (purple diamond) as of December 31, 2025, which is significantly above its 20-year historical P/E average of about 16. It also is not much higher than the prior year (blue diamond), despite the S&P rising by about 18%. Strong 2025 earnings growth, especially among mega-cap and tech firms accounted for most of the stock market performance. This is unlike the final phase of the 2000 internet bubble, when stock prices rose dramatically and unsustainably beyond earnings growth.
Japan’s stock market rose 25.1% in 2025, almost equally due to earnings growth and multiple expansion. Currently at about 16 times earnings, it is very close to its long-term average and thus does not appear to have any long-term valuation risk. The yen did not provide a meaningful boost to results as Japan was successful in its efforts to keep the yen undervalued, which is good for exports.
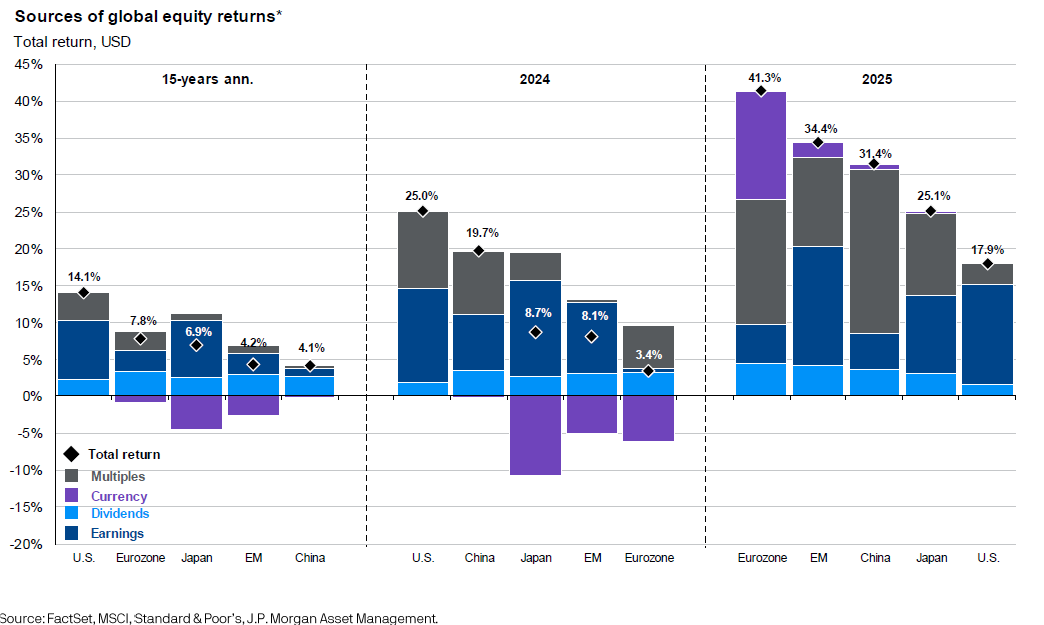
The Eurozone stock markets went from 12.5x earnings a year ago to a current valuation of 14.5x, with a 2025 positive performance of 41.3% in dollar terms. Earnings growth was positive, but currency and multiple expansion were the strongest components to an outstanding performance for dollar-based investors. For 2026, European companies will need to show evidence of better earnings growth to sustain additional outperformance relative to the U.S. We should not expect such sharp euro appreciation to continue, but the dollar does still appear to be 15-20% expensive, so euro-priced assets could continue to outperform over the longer term. Periodic dollar strength is also expected.
Emerging markets (EM) had strong performance in 2025 (+34.4% in dollar terms), partly from earnings growth plus an expansion in valuation (from a 12.8x to a 13.4x P/E) and a small currency gain. China, as part of EM, had a similar dynamic and is priced close to its 20-year average. Only the U.S. stock market is priced at a significant premium to its long-term average.
WESCAP’s significant portfolio allocation to non-U.S. stocks provided a significant boost to 2025 overall performance, though past performance is no guarantee of future results.
Earnings growth has been very strong in the U.S. and is a major reason why U.S. stocks have outperformed for many years, regardless of foreign stocks outperforming in 2025.
Earnings growth and stability are key factors to stock market returns. The following chart shows the post-pandemic earnings patterns for many countries/regions’ stock markets, as well as current expectations for earnings.
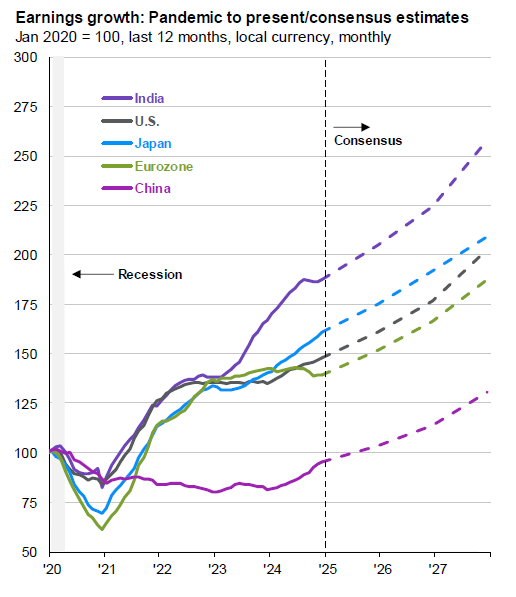

The U.S. (black line/dashes) showed strong resistance to earnings declines through 2020, while Japan and the Eurozone had much stronger earnings declines. A mix of greater tech and service firms in the U.S. and stronger profit margins may have been major contributors to this relative U.S. earnings stability. Such relative safety, combined with long-term earnings growth is one reason why U.S. stocks generally trade at a premium to other stocks around the world.
However, in 2021 both Japanese (blue line) and Eurozone (green line) company earnings rebounded and grew more quickly than for U.S. companies. By the end of 2023, earnings growth caught up to and then exceeded the U.S. The Eurozone sputtered somewhat in 2024, partly as the aftermath of the Ukraine conflict. However, by 2025 and beyond, both Japan and the Eurozone are close to matching current and expected U.S. corporate earnings growth. While a case can still be made that U.S. firms deserve a premium valuation, a strong case can also be made for the valuation premium to shrink. If this happens, it is very likely that these two major regional stock markets will outperform the U.S.
India has shown exceptional earnings growth, but as a somewhat smaller, volatile market and expensive at about 25 times earnings. We are not ready yet to make a separate India investment.
China is a different matter. Earnings (light purple line) followed a negative trajectory from 2020 to 2024. The implosion of the China residential housing market (prices down over 30% from its peak), created a drag on both economic growth and consumer spending and resulted in this large divergence in corporate earnings between U.S. and China. Nevertheless, as the housing market may be close to a bottom and other firms are doing relatively well, earnings have been strongly trending upward since 2024. As one of the cheapest stock markets in the world, this “uninvestable” market may be investable again.
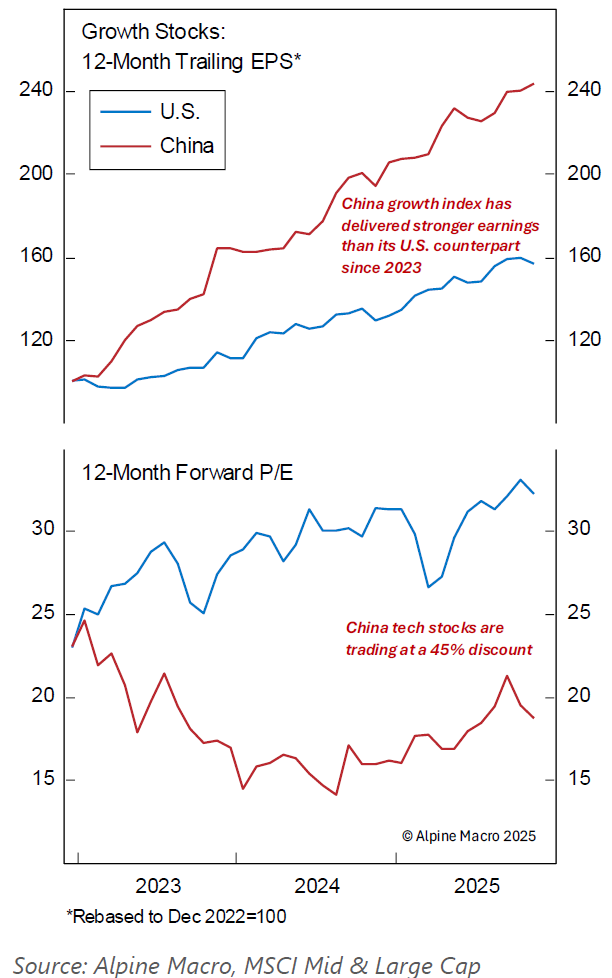
The growth/tech/AI portion of the China stock market may be particularly attractive (left graphs). Since 2023, China growth stock index earnings growth (red line) has been higher than that of U.S. growth stocks. Additionally, China tech stocks are trading at a 40% discount to U.S. tech stocks (under a 20 P/E versus 32 for U.S. tech stocks)
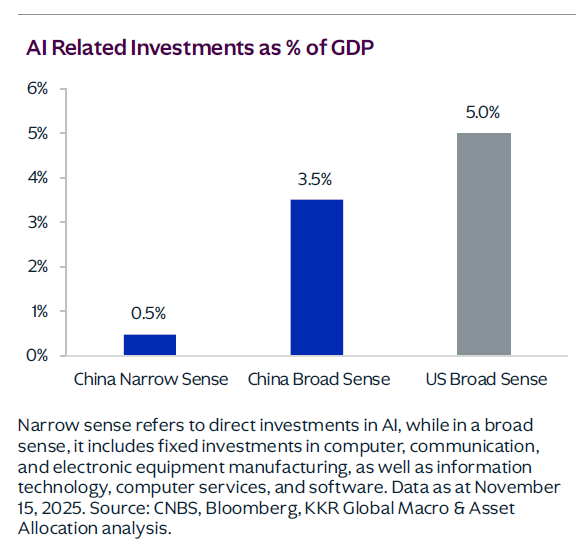
The next chart shows that China is only modestly behind the U.S in terms of AI’s contribution to domestic growth. Not only does this suggest that China growth and productivity will accelerate as it has in the U.S.; it also suggests an alternative to some of the high valuation U.S. AI/tech stocks. However, if Chinese AI is effective at productivity improvements, unemployment in China could worsen, dampening domestic consumer demand and creating social unrest.
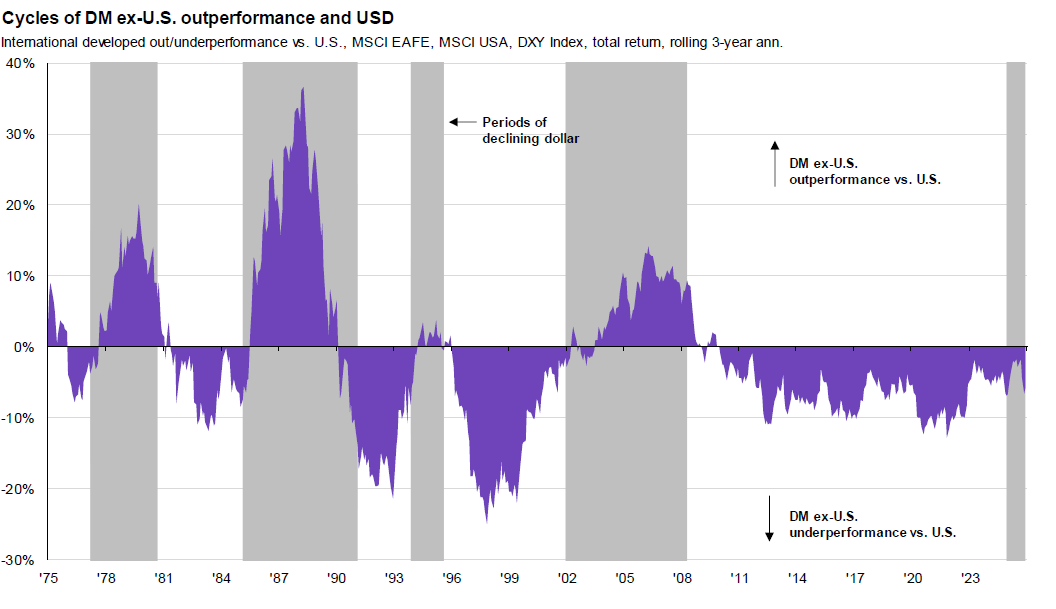
The next graph shows that the periods of foreign stocks outperforming U.S. stocks strongly correlates to a weak dollar (gray bars), which appears to have begun again in 2025. Various estimates put the dollar to still be overvalued by 15-20%, so futher dollar weakness over the next few years is probable.
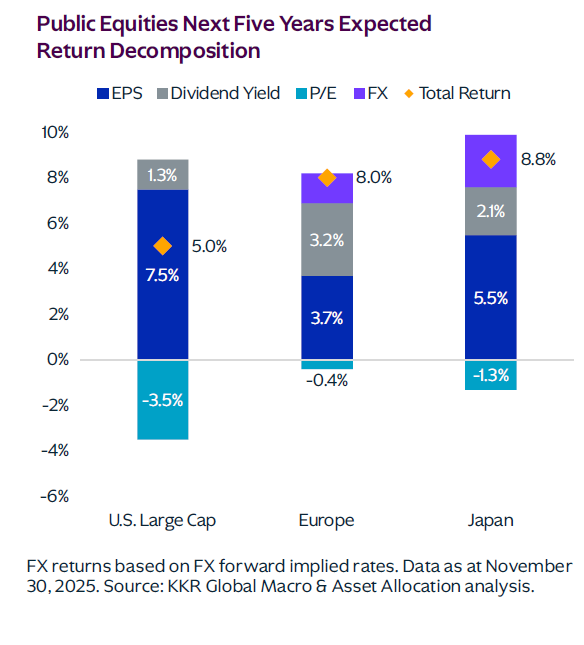
Valuations do matter. When stocks trade at elevated valuations, the subsequent future returns often tend to be anemic. The left chart shows that U.S. stocks are expected to produce only a 5% annual return the next 5 years as the P/E ratio contracts towards its long-term average. European and Japanese stocks show projected 8% and 8.8% expected annual return, respectively, as P/E ratios only contract a little, combined with positive dividend and currency impacts. Other projections (KKR, Alpine Macro, J.P. Morgan) differ in the details, but also suggest similar U.S. stock market relative underperformance. EM and China stock markets appear to offer even higher returns (details available upon request).
A year ago in our report we said “foreign stocks are at the most attractive valuation relative to the U.S., going back to at least 2004”. While not quite as attractive now, we continue to favor a large allocation to foreign stock markets. Some of this is currency-hedged to reduce volatility and some is not currency-hedged to benefit from expected appreciation from some non-dollar currencies.
AI/tech mega-cap stocks are the primary contributors to the above-average P/E ratio of the S&P 500. When the largest 10 stocks are excluded, valuations are only slightly elevated. Mid-cap and small-cap and value stocks are also more attractively valued. Broadening out U.S. stock ownership is expected to provide better returns over the next 5 years than owning the tech-heavy S&P 500.
Fixed Income and Other Asset Classes
High Quality U.S. Fixed Income: High-quality fixed income assets now offer reasonable yields, unlike most of the recent years before 2023. However, over the last 12 months, both short-term and long-term U.S. interest rates have declined. As the Federal Reserve has cut and is expected to continue to cut interest rates, we expect 3-month T-bill rates to fall from a high of about 5.5% in 2023 to about 3.6% in early 2026 and 3%-3.2% within a year, assuming inflation continues its slow descent. CDs, money market funds, bank savings and other floating rate instruments are following a similar path. What was providing a superior return per unit of risk is now providing only an adequate return. While conservative investors and those needing to hold large liquid reserves for upcoming expenditures should continue to own these assets, even as returns decline, most investors should consider at least a partial pivot to other asset classes. These asset classes include stocks, as discussed earlier, other types of fixed income assets, and various other/alternative assets.
Longer-term fixed income assets are attractive as short-term interest rates drop because higher interest rates are locked in for longer. However longer-term fixed income asset prices decline if long-term interest rates rise. This happened with disastrous results in 2022 due to very low yields prior to that year. WESCAP avoided this asset class at the time. By 2023, some of these longer duration assets became attractive and WESCAP began to add U.S. high-quality, intermediate-term fixed income assets. They generally appreciated as the 10-year Treasury note yield fell from a near 5% high to a current 4.2%. At this current yield, it is not clear if interest rates will move up or down. Inflation trends suggest lower rates, perhaps declining to 3.9% or even lower if inflation gets back down to the Fed’s target of 2%. However, increasing budget deficits, including the possible loss of tariff revenue, could offset any lower inflation benefit.
Furthermore, if AI, OBBBA-induced and foreign direct investment into U.S. facilities and other infrastructure projects, plus any pre-midterm elections fiscal stimulus creates an economic boom that surpasses productivity growth, then inflation may increase for a period of time. Along with the budget deficit concerns, we could see the 10-year Treasury note yield rising to 4.8% or higher and inflicting capital losses on bond investors. As a result, it is hard to be enthused about a large allocation to these longer duration fixed-income assets at current interest rates. Should these rates rise, we might be enticed into a larger allocation.
Credit-Sensitive Fixed income: High yield bonds, floating-rate bank loans, and private credit offer higher yields (6-10%), but do so because of potential default/loss risk and, for private credit, some illiquidity risk. Nevertheless as yields approach the potential returns of stocks, they warrant consideration. Currently, corporate defaults are lower than average and barring a recession, high yield bonds and bank loans provide reasonable return for the risk. However, the next likely move for defaults is up, not down, even if this doesn’t happen for a while.
Private credit assets do not trade publicly. Due to illiquidity, these assets command an interest rate premium. Over the past few years, interest rates have been in excess of 10%/year, but as most of these are floating-rate investments, we expect to see interest rates decline to 8.5%-9.0% by next year. This is still attractive, so long as credit losses don’t spike. Over the last few years, sponsors of private credit have created semi-liquid “interval” mutual funds that are easy to buy and own. Therefore a modest private credit allocation for risk-tolerant investors makes sense.
Real estate mortgages also offer higher yields and many different types exist—residential, commercial, insured, and uninsured. Higher-quality, non-agency (uninsured) mortgage securities appear to be in the sweet spot for yields and risk and therefore a moderate allocation to these is appropriate for part of a fixed-income allocation.
Foreign Fixed-Income: Yields in Europe and Japan are lower than in the U.S. so looking to other markets is in order. Emerging markets bonds offer higher yields and potential currency gains as well. Currency losses in high-inflation economies and default risk in shaky economies means issuer selectivity is paramount.
Real Estate
Regarding residential homes, we wrote last year “increases in home prices may slow further in 2025 and perhaps decline under adverse conditions.” Over the last 12 months, ending October 2025, the Case-Shiller Composite of home prices rose only 1.4% and has been in a declining trend since June. Mortgage rates above 6%, a weakening labor market, still high post-pandemic home prices and low consumer confidence were all contributors to this weakening home market. Rents have also declined in a number of markets, so renting is a growing alternative to home ownership.
If inflation falls to close to 2%, then mortgage rates could fall by more than 1% in the next 18 months. Assuming a stable labor market, this could stimulate housing demand. Until then, don’t expect any material improvement in housing demand or prices.
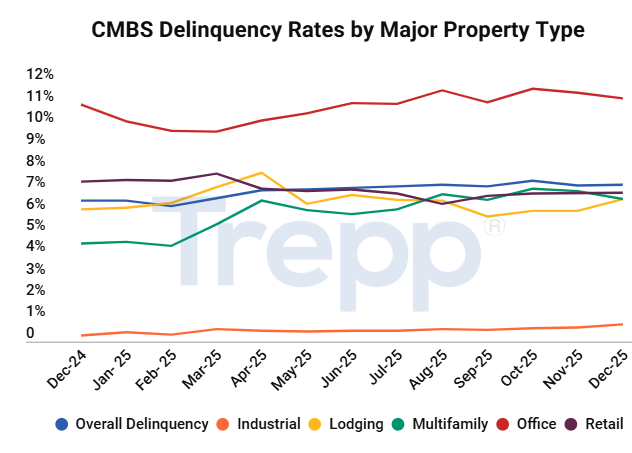
Commercial Mortgage Backed Securities (CMBS) showed flat to modestly rising 60-day delinquency rates in 2025 for most property types. Office space CMBS delinquencies have stabilized at a high 11%. Retail stayed steady at a high 8% rate. Apartments (Multifamily) have had a noticeable increase in delinquencies and are no longer a safe haven within real estate. Recently-built apartments are resulting in lower rents in some areas. Higher insurance costs, higher general operating costs and higher interest rates are negatively affecting profits. Industrial/data centers have been a strong point, but will overbuilding in this segment be a future problem in two to three years?
Many lenders continue to extend maturing loans rather than accepting defaults. As long as borrowers make the mortgage payments, the loans are not considered delinquent. This also tends to delay and prolong the difficulties in real estate.
New construction has been non-existent for offices for many years and has been very low for retail properties. Apartment construction has recently also dropped off. This is stabilizing vacancies and bodes well for a bottoming out of real estate fundamentals, followed by some slow improvement over the next few years. If interest rates decline, this could trigger more positive real estate returns, including that of publicly traded real estate investment trusts (REITs).
Hedged and Alternative Assets and Strategies: Some assets can periodically be good inflation, economic or geopolitical risk hedges. These include tangible assets like gold and other commodities. Returns were much better than expected for metals in 2025, as recovering global economies, along with aggressive monetary and fiscal policies combined with a weak dollar created extra demand for various industrial and precious metals. Futures prices are expected to be unpredictably volatile, but as they tend to have lower correlations to stocks and bonds, they can provide welcome diversification benefits to a portfolio. While oil and gas prices are not expected to significantly increase (good for inflation), increased production and shipping volume will be good for transportation, and for oil and gas firms with strong operating leverage.
Owning assets or employing strategies that are not highly correlated to stocks, bonds, inflation, or interest rates can have an important role in portfolios. Various hedged stock and bond strategies attempt to hedge out traditional stock or bond market risks. Such strategies often use a long-short approach. Examples of this include merger arbitrage, convertible bond arbitrage, options hedges and various long-short allocations using stock and fixed-income assets. As short-term fixed income assets become less attractive due to falling interest rates, these hedged strategies can help fill the continuing need for mid-return, low/mid-risk investments. We intend to reduce some fixed-income assets this year and increase our allocation to a variety of these hedged strategies.
WESCAP will continue its efforts to add value by following a disciplined, globally diversified asset allocation approach tailored to appropriate risks with frequent rebalancing, while taking advantage of market and valuation trading opportunities.
For more details, please contact your WESCAP Group advisor.